Unravelling complex corporate structures
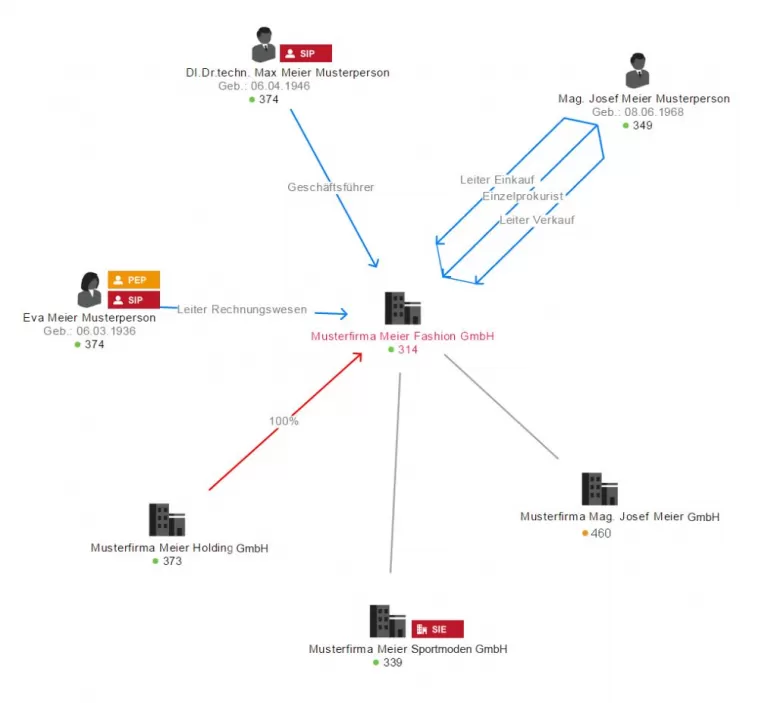
KSV1870 Visualization is a tool that gives you a clear picture of complex corporate networks in real time. It allows you to recognise relationships and connections even at the 2nd and 3rd level. This tool graphically illustrates important details, such as commercial functions and division heads, interest held, risk information and lots more.
Benefits
Get a clear picture of complex corporate networks in real time.
- Visual presentation of all the relevant information
- Real-time information from the extensive KSV1870 database
- Colour rendering of the KSV1870 rating for companies or of the risk indicator for people
- Visualizations in accordance with individual requirements
- Compliance check
- Various views if required
- Enormous time savings
Presentation
The visualization tool gives you these options
- View switching: You can show the complex corporate structures or breaking down the view to the level of individual position or owners.
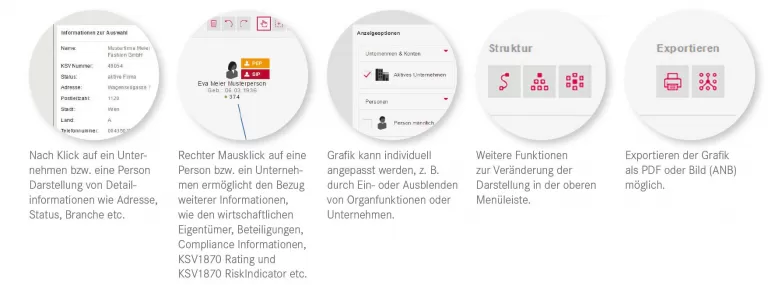
- Show or hide various views, such as interest held or individuals.
- Colour rendering of the KSV1870 rating or risk indicator in accordance with the relevant risk situation.
- Compliance check by directly showing the PEPs, etc. in the relevant network.
How to start the visualization:
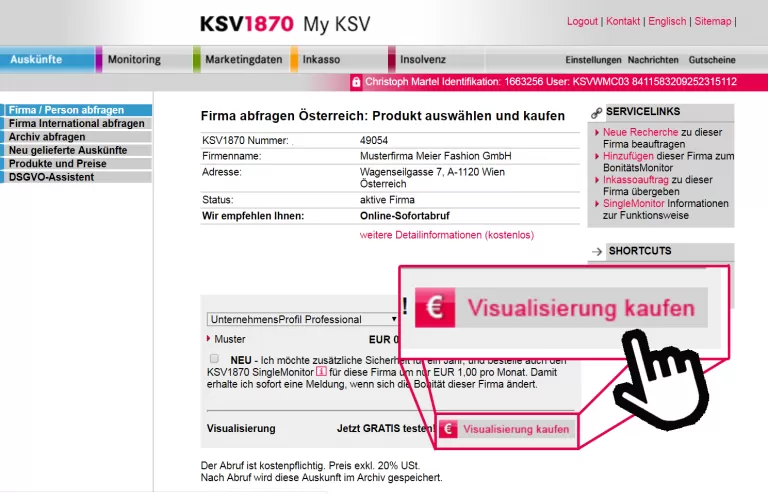
- Visit www.myksv.at and search for the desired company.
- Click on the searched company in the search results to access the detailed view.
- In the detailed view, click on "Purchase Visualization." This action will open the KSV1870 visualization in a new tab.
Interesting facts
- Financing transactions undergo an authorisation process where risk situations need to be shown in graph form. KSV1870's partnership with CIN Consult GmbH brings you an innovative solution. It takes only one a click to obtain a visual image of the ownership structure and its relations to what is depicted in the image in presentations or approval processes.
- Using the KSV1870 visualization, you get to automatically convert comprehensive, always up-to-date KSV1870 data into the format you require and illustrate relations – even of complex corporate networks – in a clear manner.
- You obtain real-time depictions that meet your specific needs by creating individually personalised visualizations using the extensive KSV1870 database.
If you have any questions, please contact us by dialling 050 1870-1200 o sending an email to info.service@ksv.at. We will be happy to advise you!


